Ontdek & leer
Prowise op Facebook

Lessen
Welkomstpagina/dagstarter
Lessen
Lesinspiratie op Facebook

Lessen
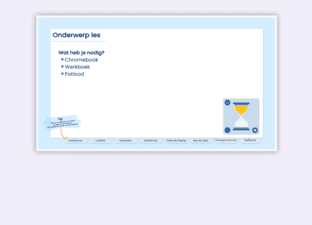
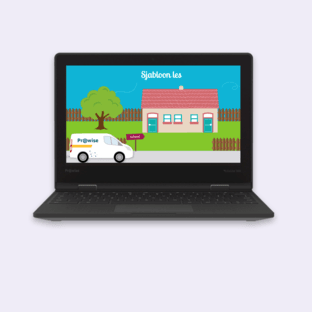
Sjabloon EDI-model
Lessen
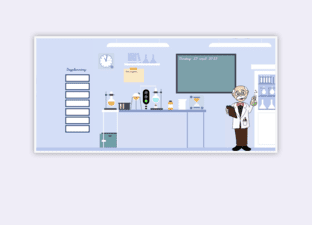
Dagstarter wetenschap & techniek
Lessen
Welkomstpagina cactus
Lessen
Dagstarter verkeer
Lessen
Dagstarter alpaca
Lessen
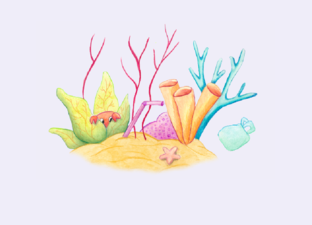
Dagstarter Onderwaterwereld
Lessen
Zomer
Lessen
Water
Lessen
Bruggen
Lessen
Escape uit de digitale Jungle
Ontdek & leer
Registeren Prowise Presenter
Ontdek & leer
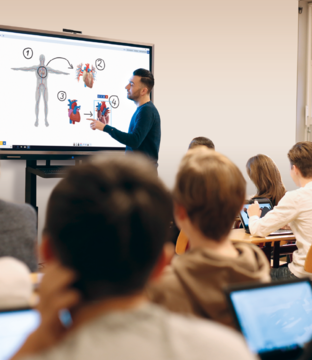
Prowise in het onderwijs
Ontdek & leer
Presenter Tools Klassenmanagement

Lessen
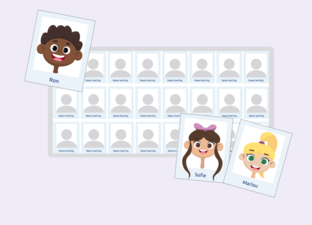
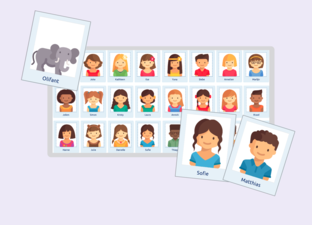
Wie is het? - Leeg sjabloon
Lessen
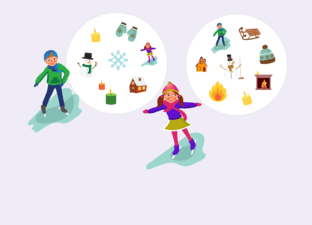
Spel Dobble - winter
Lessen
Houdingen memory
Lessen
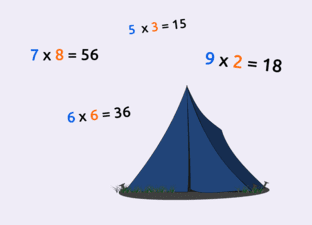
Kampeerspel
Lessen
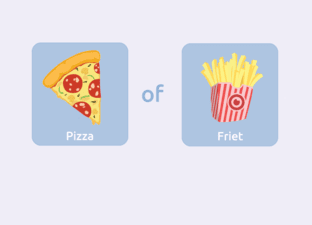
Vier op een rij
Lessen
Kraanwaterdag
Lessen
Wie is het? - Mensen of dieren
Lessen
Ren je rot!
Lessen
Templates/sjablonen
Lessen
Floep in de plasticsoep
Lessen
Pasen

Lessen
Woordzoekers Koningsdag
Lessen
Koningsspelen 2025
Lessen
Vaderdag